
It’s one thing to get Google Analytics installed. However, knowing how to use it in the right way is another thing entirely. Often, new marketers will struggle to drive traffic to their site. All the while, they are not using the amazing insight that Google Analytics Reports can offer them.
After all, there are hundreds of metrics you could potentially track. So, if you are not a Google Analytics expert, it can seem almost impossible to know where to start.
If you are new to Google Analytics Reports and feel bogged down by all of the bells and whistles, this blog post can help you get a hold of tracking what really matters to your business.
Customization Is Key
Many people seem to think that just downloading Google Analytics Reports is the be all end all. However, this is a very common misconception and can be a very costly mistake. Once you download it, some creative customization is necessary. Without it, any information you get is just a relevant suggestion.
If you want a quick and easy crash course on Google Analytics basics, take a look at this video:
Unless you tailor the reports especially to your business, the information will not point you in a specific direction that has to do with your business. This means that it can not do much in terms of helping you make important decisions.
How To Cut Out The Clutter
What you don’t need is an overflow of general information that does not directly have to do with your business. Also, no one has the time to check hundreds of metrics regularly. So, what you really need is a faction of specific data that is simple for you to understand.
In order to get the most useful actionable data about your digital performance, you need to use custom reports and fragmentation through segments. Here are the main Google Analytics reports you should focus on to get the information you need.
Active Users
Active Users reports website stats:
- Daily
- Weekly
- Bi-monthly
- Monthly
This report can tell you how many active visitors you have in a span of time. When you look at your daily or weekly users, you want to know how many of them are active. You can find this information by going to Audience and then looking at Active Users.
Most new business owners are particularly interested in closely monitoring their daily users. In addition, this report is useful when it comes to understanding if you are able to successfully drive more visitors.
Audience Location
It doesn’t matter if a business is a multi-national corporation or a small online business. Everyone wants to know where exactly their core audience is. With a location Google Analytics Report, you can know exactly where your core audience is located.
You can access this information by navigating to Audience > Geo > Location.
Tailor Your Google Analytics Reports To Your Needs
Here is one big opportunity for customization. To start, this tool defaults by showing you the top 10 countries. However, if you are a specific local business that only performs services in one or two cities, this likely will not help your business much.
Depending on your needs, you can change the primary dimension. You can display reports by city, region, and even entire sub-continents too. You can really break down this data and see where your audience is.
SEE ALSO: 7 Free Google Tools All Digital Branders Should Use
New vs Returning Visitors
Google Analytics is capable when it comes to figuring out who is a new visitor and who is a returning visitor. Google accomplishes this with code. In injects a small piece of code that contains an ID into the visitor’s browser on their very first visit to your site.
If they make a second visit, the Google Analytics code will recognize that ID and mark them as a returning visitor. This particular Google Analytics report helps you understand exactly how many visitors are coming back and how many you are gaining. It can also give you insight into their behavior too.
You can find this report under Audience > Behavior > New vs Returning Visitors.
Device Category
It’s no secret the mobile use is sweeping the digital world. In the United States alone, 63% of Google’s visits are conducted by mobile devices. And in 2019, mobile devices have accounted for about half of all internet traffic globally too.
This means that if your website is not friendly to mobile users, you may be missing out on most of your potential traffic and eventual conversions.
Google Analytics Reports offer you the ability not only to know who is accessing your site but from which device they are doing so too. This information will allow you to tailor your site to be optimized and accessible across devices.
You can find this information through Audience > Mobile > Overview.
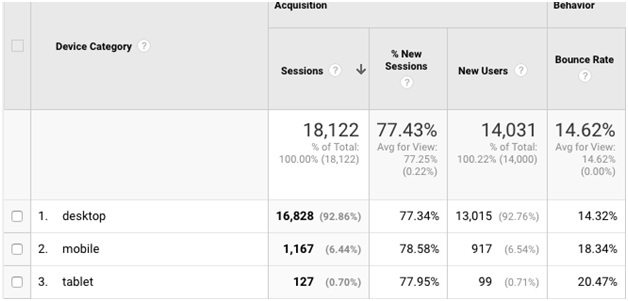
The report will show you visitors broken down by device category such as desktop, mobile, and tablet. If you like, you narrow this information down even further. You can see the brands of the devices used too.
User Flow
You can use User Flow Reports to see the traffic flow for a specific source or location. For example, you can see where users located in the United States navigate after they come upon your landing page. Do they leave your website? Or do they navigate to another page?
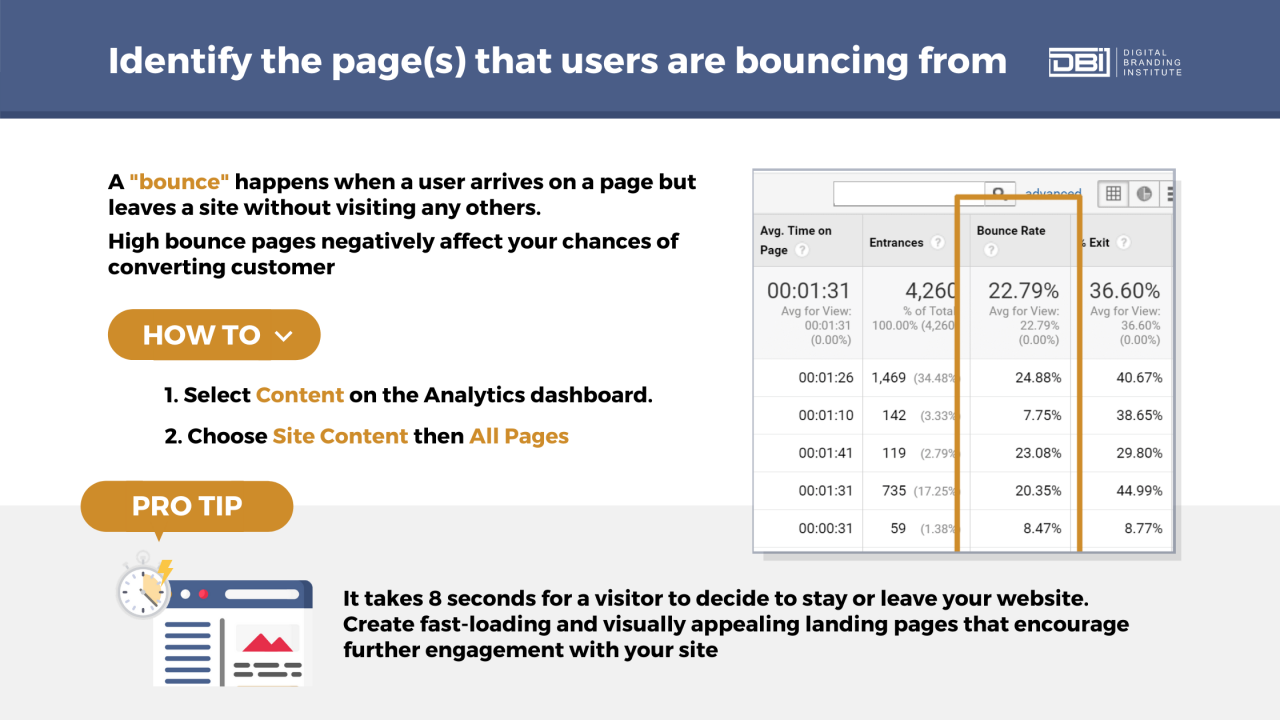
If most of your visitors leave after visiting your landing page, it means that something is not connecting. A high bounce rate can indicate a number of problems that cause users to leave.
On the other hand, if most visitors go to one particular page, it is important to take note of what makes it so effective and replicate it or elements of it, if possible.
Top Traffic Channels
When choosing which Google Analytics reports to focus on, you do not want to forget about its channels report. This will tell you the most powerful marketing channels when it comes to generating traffic for your website. There are 8 default channels in Google Analytics. These include:
- Organic Search
- Paid Search
- Display
- Direct
- Referral
- Social
- (Others)
You have the option of accessing these in multiple specific reports. However, you can also look at them as a basic single report.
To do this, navigate to Acquisition > All traffic > Channels.
Keep in mind that if you are running any paid advertisements, these will show up as additional channels. This report will help you understand exactly what is generating the most traffic for your business.
Based on its information, you can decide which channels to focus more on. Also, you can choose which to focus less on. Remember, there is no magic formula in this case. Every brand will be different, which is what makes these reports so important when it comes to decision making.
Landing Pages
The Landing Pages Report will show you the top pages that are ranked on Google search. It will give you a complete picture of how all of your pages are performing too. This includes:
- Impressions
- Clicks CTR
- Average position on search results.
So, in order to take a look at this report, you will first have to connect Google Search Console with Google Analytics. This will grant you access to all of the search results in Google Analytics.
In order to see it go to Acquisition > Search Console > Landing Pages.
The search console report will give you the complete SEO data of your pages. You will be able to click on any page to check the keywords that it has ranked for too. You can also check how your keywords perform after on-page or off-page SEO updates.
Top Campaigns
In the beginning, most website owners start off with paid campaigns in order to drive traffic and make sales. So, you want to measure the exact performance of each campaign if you choose to run them. You also want to make sure that you are not pouring money into them for lackluster results.
In order to do so, access the Campaigns Report in Google Analytics Reports. You can use the All Campaigns Report to view everything from the performance of newsletters to custom campaigns.
You can view this by going to Acquisition > Campaigns > All Campaigns.
If you are new to this and feel a bit lost when it comes to building custom campaigns, there are helpful tools available. Take a look at the UTM.io URL builder, for example.
Behavior Flow
Google Analytics Behavior Flow Report shows a visual representation of how traffic flows on your site. It will show you what pages visitors land on and also where they go next.
This helps you know where your content is connecting with your visitors. It also lets you see which of your CTAs are the most effective. Understanding engagement is key to making the right decisions.
This report can be accessed through Behavior > Behavior Flow.
All Pages Report
This report is incredibly important. You want to be sure to keep a regular eye on it, perhaps even weekly. This report gives you insight into which post has the most views, the average time spent by users on page, and also your bounce rate.
You can tailor this, however, you can also choose to view pages by title as well as content groupings.
You can access this information under Behavior > Site Content > All Pages.
Event Tracking
Event Tracking gives you the ability to record specific actions. These actions could be a number of things. This includes video plays and forms submissions too.
You can track these things by including a piece of code into your analytics tracking code. However, in order to view the report, you have to set up Event Tracking first.
You can access this report by going to Behavior > Events > Overview.
Referral Report
These reports display the list of sites that redirect traffic to your page. However, this report does not generally include organic search and advertising visits. It does, however, give you a general insight into the behavior of referral visitors on your site.
Above all, you can see both how long these visitors stay and also which pages they choose to look at.
Go to Acquisition > All Traffic > Referrals to access this information.
Goal Completion Report
It is important to set specific goals for your business and then work to reach them. Of course, everybody wants more visitors, more meaningful traffic, and more conversions. However, these are rather vague general objectives.
Google’s goal completion report can help you get more specific. It can help you get a quantitative perspective on how you are achieving your goals.
In essence, it does this by displaying the number of each goal conversions within a specific date range. You can know, based on certain timelines, what exactly you are achieving.
You can take a look at this report by going to Conversions > Goals > Overview.
SEE ALSO: How to Best Use Goals In Google Analytics
How To Keep Up With Your Reports: The Easy Way
Marketers have countless things to do every day, and there are only so many hours in a day to get it all done. If you have been wondering throughout this blog post how on earth you are supposed to find the time to manually monitor over a dozen reports daily, weekly, and also beyond, don’t worry.
Google has actually introduced a feature that makes keeping up with your reports simple. Their Automatic Email feature sents reports directly to your inbox. It also does this according to a timeframe you specify. This can be daily, weekly, monthly, or even quarterly.
However, it still might seem a little daunting to receive more than a dozen separate reports in your inbox regularly. Wouldn’t it be easier to have just one email sent to you that contains all of the reports?
Here’s how you can do it.
How To Put Your Top Reports In A Single Dashboard
- Click on customizations from the left menu
- Choose dashboards
- Then, click on the create button
- Enter your dashboard name, select blank canvas, and click create a dashboard
- Go to any of the reports which you want to keep track of for your business
- Select add to dashboard from the top navigation menu
- Choose the dashboard you just created and select how you want to display it (timeline, table, or both)
- Click the Add to Dashboard button
Each report in the dashboard is called a widget. You can add up to 10 widgets per dashboard too. First, add your main reports to this dashboard.
How To Get That Report Sent Directly To Your Inbox
- First, click on email in the top navigation menu of the dashboard
- Next, enter the email address you want the reports to be sent to
- Finally, select when you want to receive them
Your report will arrive in a PDF format. You can choose how often you want to receive it and on which day of the week it will come too. In addition, you can also choose how long you wish to receive them for, up to 12 months in advance.
Final Thoughts On Google Analytics Reports
So, there are potentially hundreds of metrics a marketer can track and worry about using Google Analytics. However, choosing to start with only these will give you a solid foundation of useful information to track and work with, that isn’t too overwhelming.
Which metrics do you think are most important? Comment below…